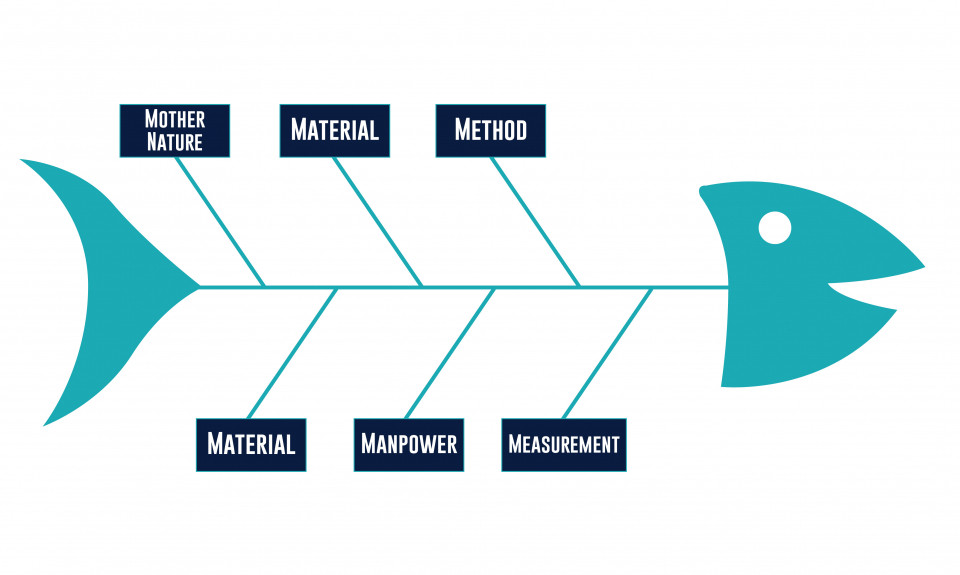
Origin and definition of the Ishikawa diagram
The Ishikawa diagram, also known as the fishbone diagram, is a tool designed by the Japanese chemical engineer Kaoru Ishikawa in 1943 to create a standardized method for identifying and helping to solve problems in a system. It shows how cause and effect are linked, and helps to analyze what's wrong with systems, processes and/or products.
Why use the Ishikawa diagram?
This diagram shows :
determine the set of causes that produce a studied effect (i.e. the problem)
identify levers for action to solve a problem
Advantages of the Ishikawa diagram
The diagram's highly visual representation makes it easy to :
Highlighting possible reasons for a problem occurring simultaneously, and immediately ruling out certain assumptions,
Revealing weak points or bottlenecks in processes,
To promote better team communication,
Memorizing and reusing information,
Accelerating problem-solving through brainstorming.
Components of the Ishikawa diagram
 The Ishikawa diagram is made up of 6 themes called the "6 M's" which, when analyzed, tend to attribute most of the causes of business problems. Each 'M' represents an aspect of the business that may be at the root of the problem to be solved.
These "6 M's" are as follows:
- Method
- Measurement
- Material
- Machine
- Mother Nature
- Manpower
Understand the meaning of the 6 M :
1. Method
The aim here is to list all the potential causes linked to the procedures and way of working used to produce a service or product.
2. Measurement
In this case, we're looking at the causes linked to the way in which quality and progress are assessed throughout the process, and how results are measured at the end.
3. Material
This term refers to the physical and non-physical components of a system, including the resources, data, raw materials and, in some cases, tools that are at the root of the problem.
4. Machine
The aim here is to examine the machines and equipment used to create or supply the product or service. Analyze the causes and effects that could hinder or slow down the process.
5. Mother Nature
By environment, we mean the external factors that affect the system, the environment, competition, geography and regulations that can cause problems.
6. Manpower
The workforce covers all the human resources involved. The aim here is to identify the causes linked to the skills or qualities of the teams, their state of health, the number of staff, their distribution, etc.
ð Of course, all these elements need to be adapted to the specific field of activity.
Mechanisms underlying the Ishikawa diagram
The mechanisms used to construct the Ishikawa diagram are:
Divergent thinking, exemplified by ideation and the formulation of assumptions
Convergent thinking, which means selecting the causes that generate the problem
These two mechanisms are illustrated below.
How do I draw an Ishikawa diagram?
To produce an Ishikawa diagram, a certain amount of rigor is required... This is reflected in the respect of 5 successive steps:
- Qualifying the problem
The first step is to define, agree and write a clear, precise statement of the problem. The fish's head will represent the problem statement (= undesirable effect) and the horizontal line the fish's backbone.
- Brainstorming
Brainstorm as a team to identify the main potential causes of the problem. (Divergent thinking)
- Identify potential causes of the problem
Once these main causes have been identified, they need to be categorized using the "6 M" method. (Convergent thinking)
On the horizontal line representing the diagram's backbone, add branches starting from this line. (See photo above). They represent each of the predefined categories of causes of the "6 M's" and will thus materialize the fishbone.
Smaller sub-lines from a cause line may be necessary if that particular cause is a little more complex.
At this stage, make sure you identify the causes of the problem that you can influence to change its effect. This will enable you to exclude action plans over which you have no control...
- Analysis
At this stage, the fishbone diagram is well developed and, in principle, shows all the possible causes of the problem statement. You may then decide to investigate the subject further, using surveys and polls. This will help you narrow down the possible causes of the problem. You can also prioritize the level of impact and probability of occurrence of each cause: strong, moderate or weak.
- Defining an action plan
On the basis of the previous analysis stage, focus on the causes that have a strong, proven influence on the problem, and draw up an action plan to deal with any malfunctions.
Ishikawa diagram application areas?
Generally speaking, this diagram can be used in any progress approach!
Its primary objective is problem solving, to discover the source of the problem, but it can also be used for process optimization or prevention, as part of risk management, to defuse future problems...
As you can see, in this article, rather than giving you the fish we've given you a tool to learn how to fish! 😊
Elizabeth TOUCAS - Executive Strengths Coach & Career Manager - IÉSEG Network
For any requests you may have for personalized Executive Coaching or for information on the Career Development Services, please contact me: e.toucas@ieseg.fr or +33.6.85.33.01.57.

Comments0
Please log in to see or add a comment
Suggested Articles

